
Financial Stress – Low Low Low Low Low…
The following charts show an alignment between the dominant cycle in the VIX index (daily) and the dominant cycle in the St. Louis Financial Stress Index (weekly):
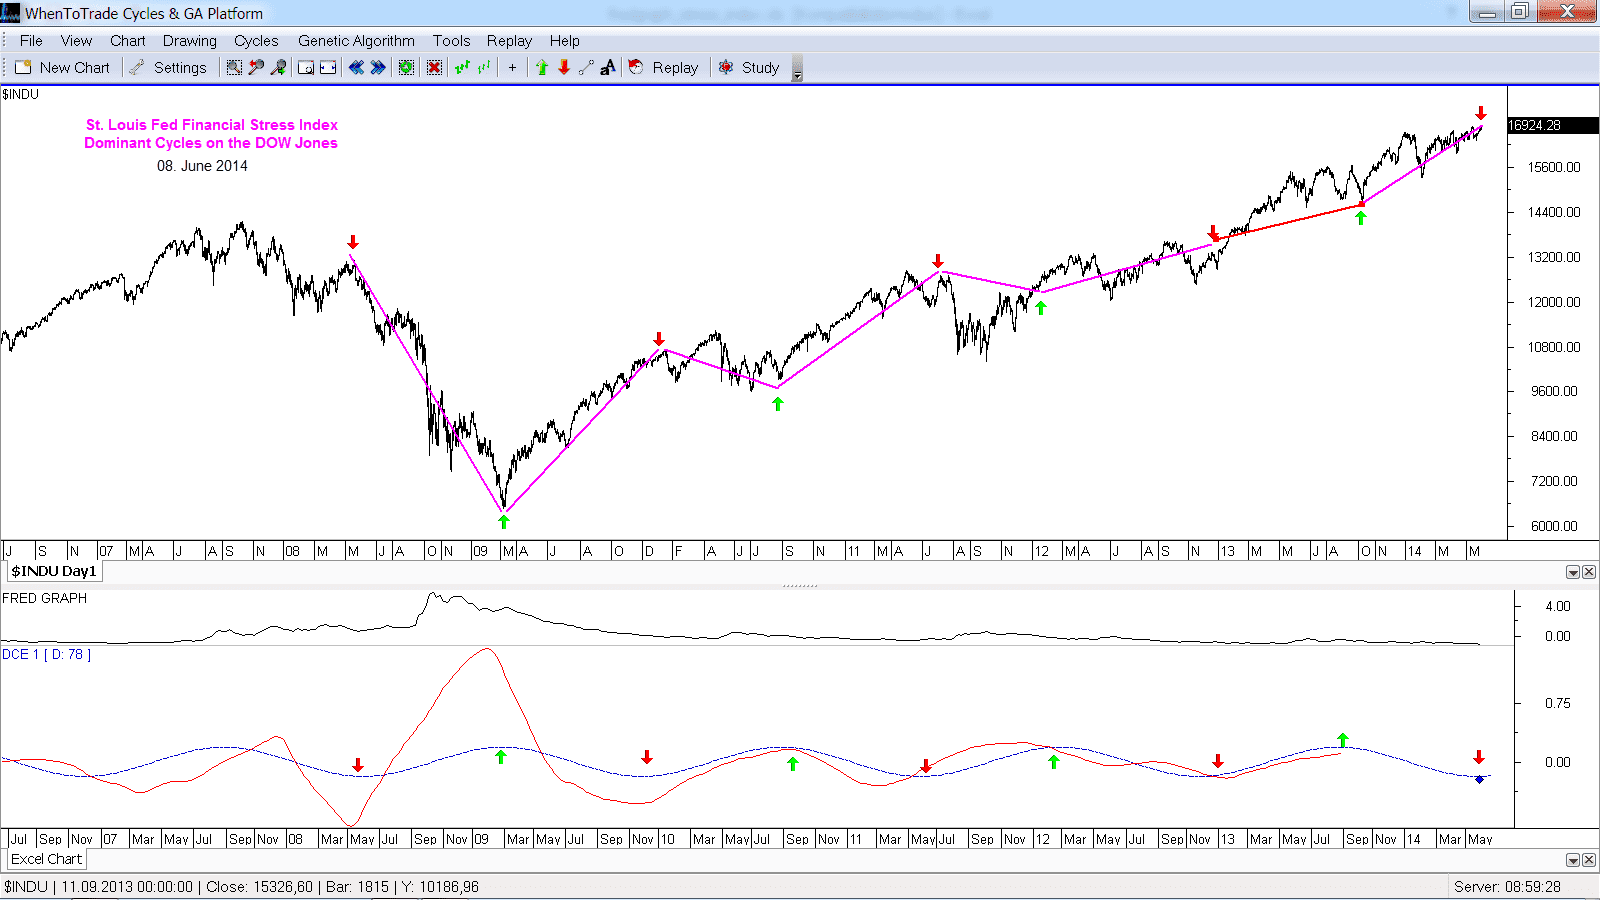
St. Louis Financial Stress Index Dominant Cycle
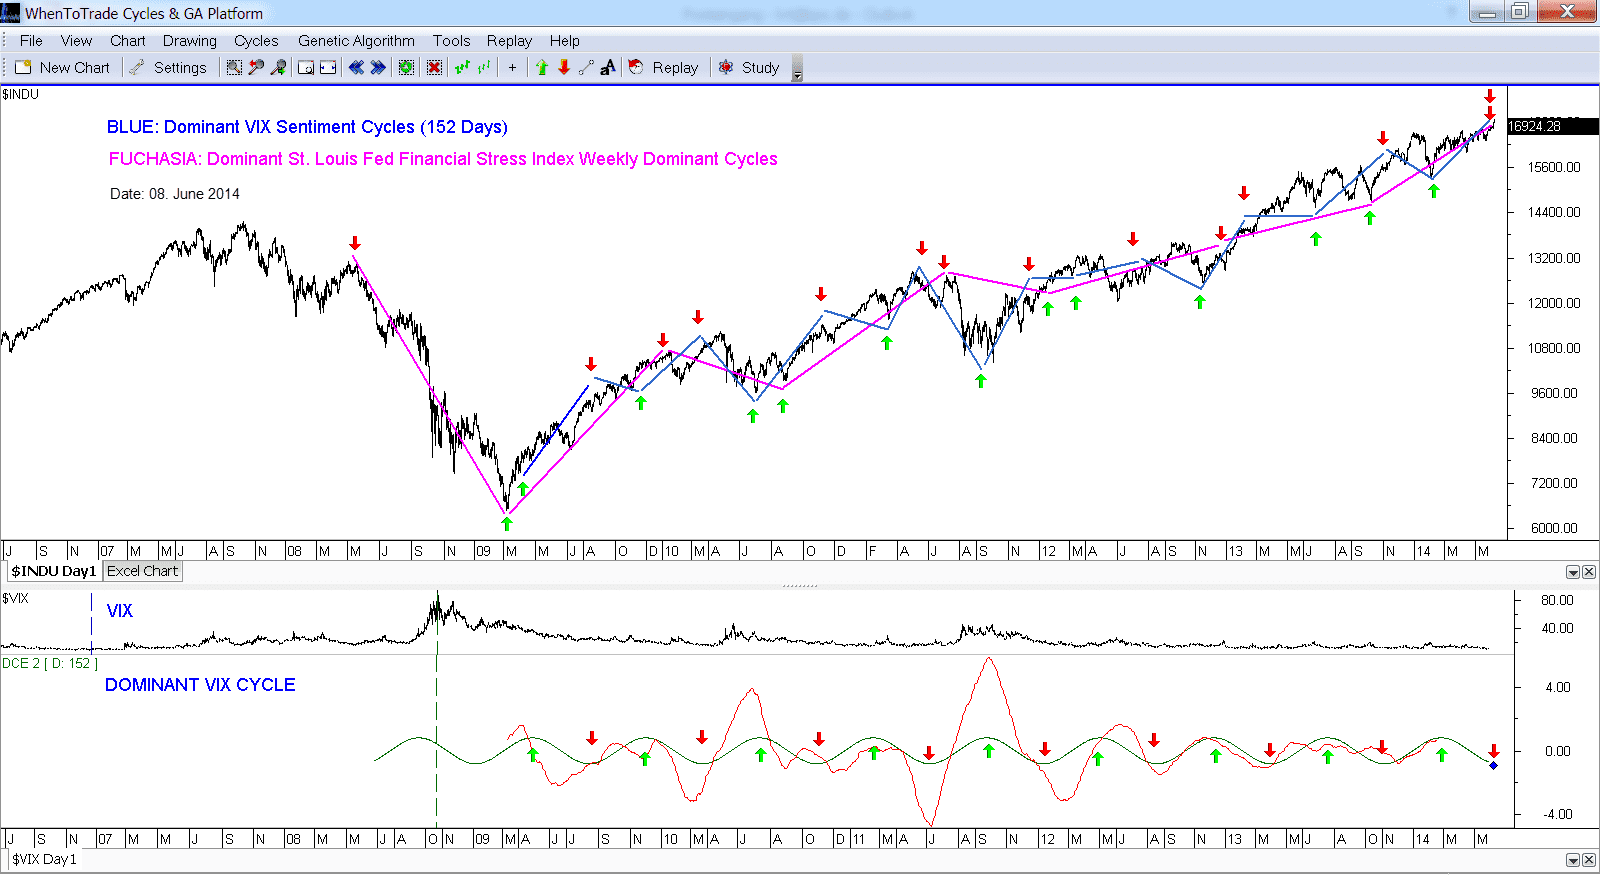
VIX and Financial Stress Index Dominant Cycle View


Please read the report for the “after the fact” review and the predicted drop just after this call.
https://whentotrade.com/market-snapshot-review/
Our cycles projection did not only call the top of the year, it represents also the largest drop for the year:
I was asked how to trade this signal on a short-term basis. Here is a very basic way to trade it:
Just go long the VIX ETF one day after the signal and exit one day after the cycle swing index gave a turn above the upper range. It is the basic strategy teached in Book 1 “Dynamic Cycles”. A very basic +10% profit trade in just one week with clear entry and exit signals:
Just the final review. The Financial Stress Index gave us a 74 week cycle – which signaled us to not see this price level for a long time…
