
Non-Linear Indicators – Cyclic Time Part 2
Setup Non-linear Indicators – The Concept of Cyclic Time in Technical Charting
Today, according to modern understanding, time is considered to progress in a linear manner. Many theories exist on the nature, origin, end and other matters related to time. Ancient societies also dwelled on questions related to time and formulated concepts and proposed various models to describe their naked eye observations and deductions based on logic.
Most of the ancient societies believed that time progressed in a cyclical manner. They observed the cyclical nature of the day and night, witnessed similar repetitive patterns of seasons year after year, the monthly cycles of the moon and its changing shape, etc., and applied the same concept for larger time scales as well.
In our “western thinking” and “left-brained” world, we always use the linear concept of time. It has become so “normal” in today’s world that no one questions it. However, awareness of the consequences can have a tremendous impact when building technical indicators and trading systems.
Today and in every charting application, technical analysis is placed in the logic of linear time. Every TA indicator or study uses the last n-bars period to judge the current condition and to derive trading rules and logics, e.g., RSI(13).
Why are the current last n-bars important for judging the current condition? Nobody questions this since we believe that there is only one rule set for time: linear. Hence, all our indicators are based on the linear time concept of our “modern” world.
However, perhaps the bars n-days/years in the past related to a given cycle are more important to rate the present condition than the current last n-bars. This would correspond to the cyclical concept of time. Unfortunately, this idea is not available in financial charting applications for building technical indicators.
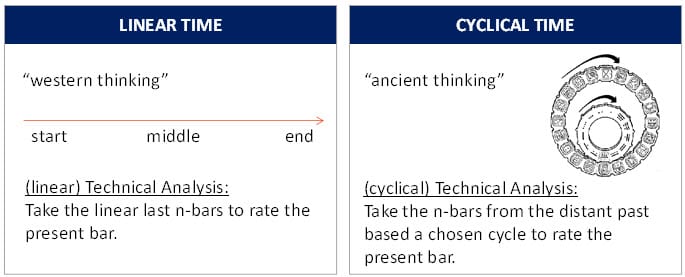
Figure 1: Linear vs. cyclical time in technical analysis (TA)
Combination of linear and cyclical time to build predictive indicators
We need to consider the following to convert linear time-based indiccators into cyclical time:
We will assess the current market condition based on the distant past and not on the current past. So, we are using the same indicator calculation, but are putting in bars from the past instead of from the current linear past. To do so, we need to define a point in time from when to use the data, e.g., 365 bars back instead of 1 bar back.
I have already introduced 3 important cycles which reflect a recurring pattern that impacts life on Earth: The Metonic cycles introduced and explained in my book “Decoding The Hidden Market Rhyhtm – Part 2: Metonic Cycles”. ( Book Link )
The Metonic cycles represent a classical real example of cyclical time since they provide us with a cyclical pattern for the same position of the planets Earth, Moon and Sun before our stars. These interactions influence the operation of our electrochemical nervous system which is linked to the limbic system which in the end controls our emotions.
To rate the cyclic sentiment situation today – or to build the indicator score for today based on metonic cycles – we will use the bar 8 years, 11 years, and 19 years ago. Not the current last n-bars – they are completely useless if we follow the cyclical time concept.
Based on this concept, we can already build the indicator into the future for as long as the shortest chosen cycle is. In this case, we can calculate the indicator 8 years into the future. To transfer this concept to an indicator calculation is quite easy. For example, to build a cyclic RSI indicator, we do the following:
a) Calculate the linear-time indicator for the past:
e.g., using a standard RSI(n); (n: length)
b) To build the cyclic-time indicator score, build another indicator that simply uses the outcome from the linear-time indicator and build a composite from the cycles used.
For our Metonic RSI indicator, the pseudo code would look like this:
RSI(n) |today, cyclic-time| = ( RSI(n)[6939] + RSI(n)[4016] RSI(n)[2922] ) / 3
Patterns and cycles other than Metonic cycles certainly exist. However, I have already outlined the strengths of Metonic cycles in my book. You can replace the RSI indicator with any one of your favorite indicators to be transformed into cyclical time based version.
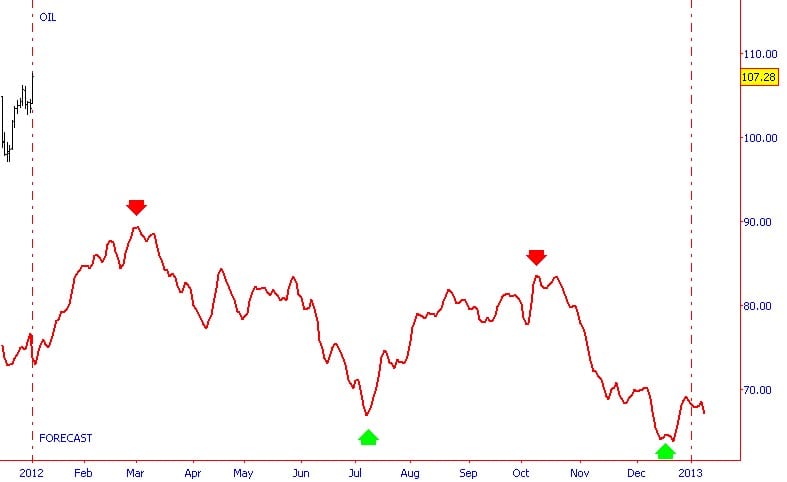
The following chart is a real-case example that was used in private trading seminars and represent one possible way to interpret a non-linear indicator plot. In these instances, the PercentageR time-based indicator was used to build the cyclic model via the Metonic cycles pattern, keeping to the formula used in the pseudo code presented above. The indicator has been plotted in advance into the future.
Example Crude oil futures contract – CL
This example shows the crude oil futures contract at the end of 2011 with a full predictive non-linear indicator plot for the course of 2012. One possible way is to look for the maximum and minimum readings of the indicator plot to identify future areas of potential market highs and lows. As the indicator does not provide an exact forecast each day, the first step would be to check the general extremes. Extreme situations are marked with red and green arrows on the chart.
Crude Oil – Cyclic Time Forecast
The second chart illustrates how this forecast was able to predict the major turning points of crude oil for 2012 in advance.
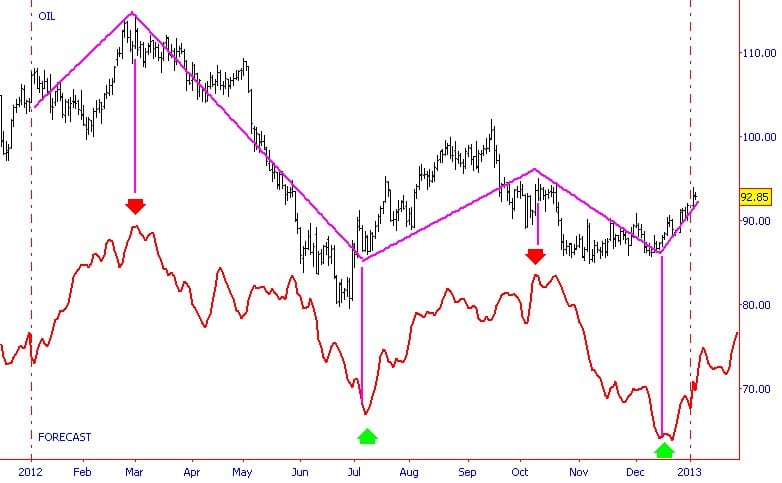
Crude Oil – Cyclic Time Outcome
Building trading systems with cyclical time-based indicators
After witnessing the predictive power of this technique, you can use this concept to build mechanical trading rules based on the created cyclical time-based indicators. For further reading and concrete pseudo code details, I introduce different purely mechanical trading systems in the book “Decoding the Hidden Market Rhythm – Part2: Metonic Cycles” and compare the standard linear time-based model against the cyclical time-based one to demonstrate the predictive advantages of the new non-linear indicators.
Charting platform and the automatic creation of non-linear indicators
Almost no charting platform is able to build non-linear cyclic indicators and transform them into cyclic time for plotting on a trading chart, as the West has a conceptual bias towards linear time. Opening our minds to the concept of cyclical time will present new possibilities and tools for technical analysis. This is part of why we have built the WhenToTrade charting platform, capable of building and plotting non-linear indicators.
A cyclic module for automating the transformation from linear into cyclical time based on any one of a full range of cycles and indicators is available in the WhenToTrade platform. Before transforming a linear indicator into its cyclic pendant, it is crucial to define the pattern to be used for the transformation; for example, an intraday sunrise/noon/sunset pattern might be used as a repetitive pattern during a trading day. There are many more possibilities.
I hope this article helped to broaden your view beyond the linear time concept; it is merely one of many ways to conceive of time, and I have attempted to show you concretely how to conceptualize others.
Let’s finish with reference to a well-known work:
“History repeats itself. In order to know and predict the future of anything you only have to look up what has happened in the past and get a correct base or starting point.” (W.D. Gann, TUNNEL THRU THE AIR, 1927, Chapter VII: Future Cycles, Page 75ff)
Please also read article “Cyclic Time Part 1“


Leave a Reply
Want to join the discussion?Feel free to contribute!