API based Dominant Cycle Analysis – Excel Workbook
![]()
We have moved our core cycle analysis engine into the cloud and are now able to provide all cycle analysis tools via RESTful API endpoints.
Please visit and check our growing API documentation regularly for more updates. (API DOCS)
Our first endpoint allows you to do dominant cycle analysis for stocks, index data, forex and commodities without the need to subscribe for data-feeds and complex tooling integration. The endpoint gives you all dominant cycle information, including full time-series charting data with a single call. You can try the endpoint via our swagger interface here: TRY CYCLE ENDPOINT API
To get you started quickly, we provide here a short Excel sheet which allows to pull up dominant cycle information and to plot the chart with cycle as indicator. Exactly as you do it with charting software. However, here without the need for any charting tool or any datafeed subscription.
We just use the PowerQuery functions available in Excel to connect to external data-sources. There are two sheets prepared:
The first sheet allows you to specify the symbol/market to analysis and to change the parameters for the request. The update button refreshes the data and the table below shows the detected dominant cycle data.
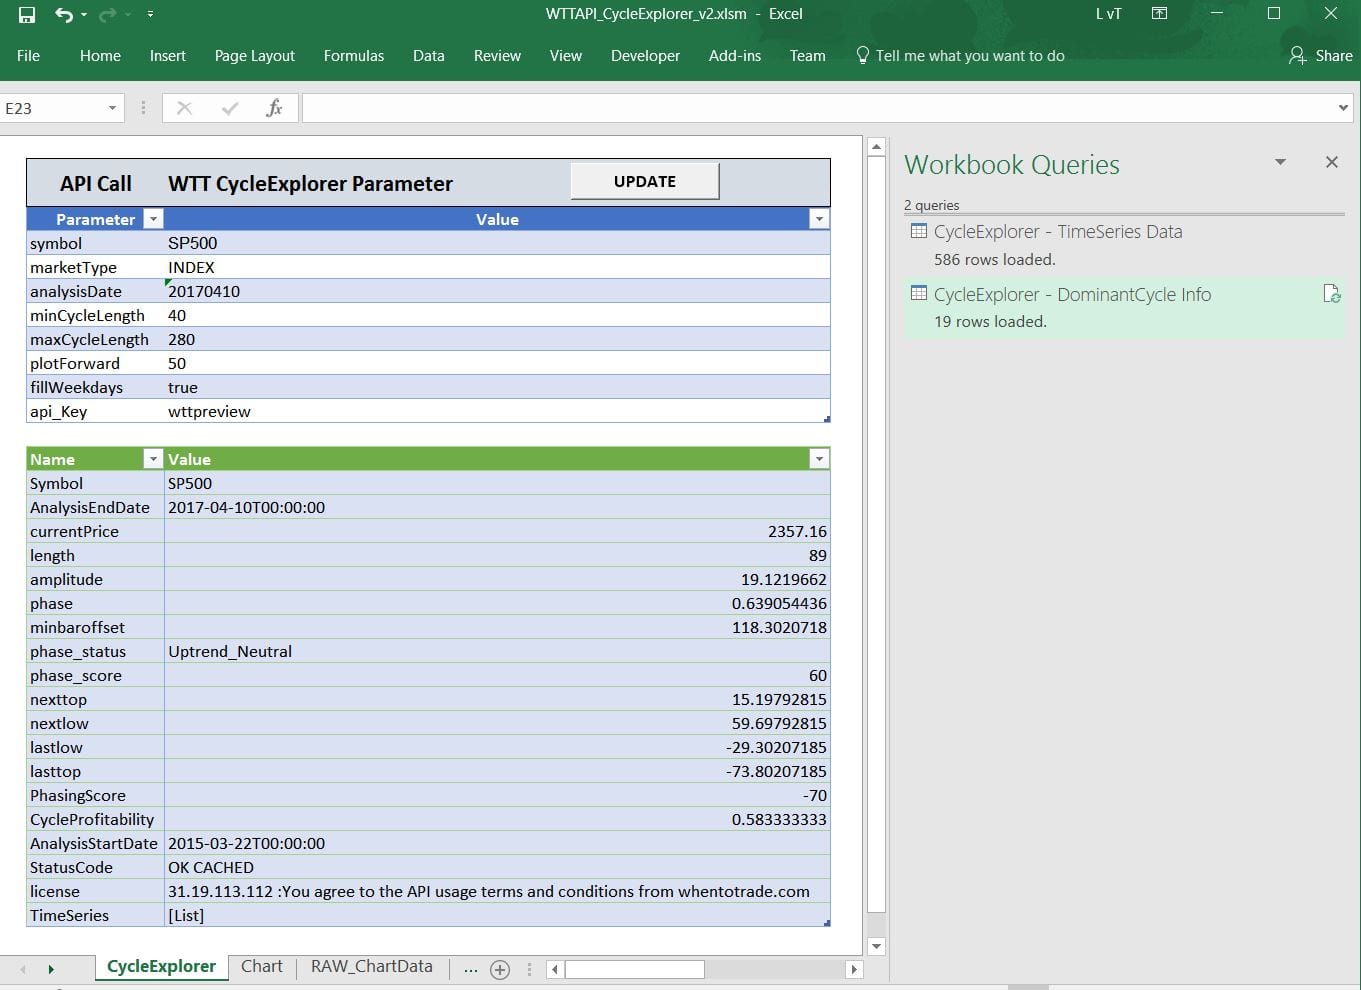
API Excel Connection Parameter
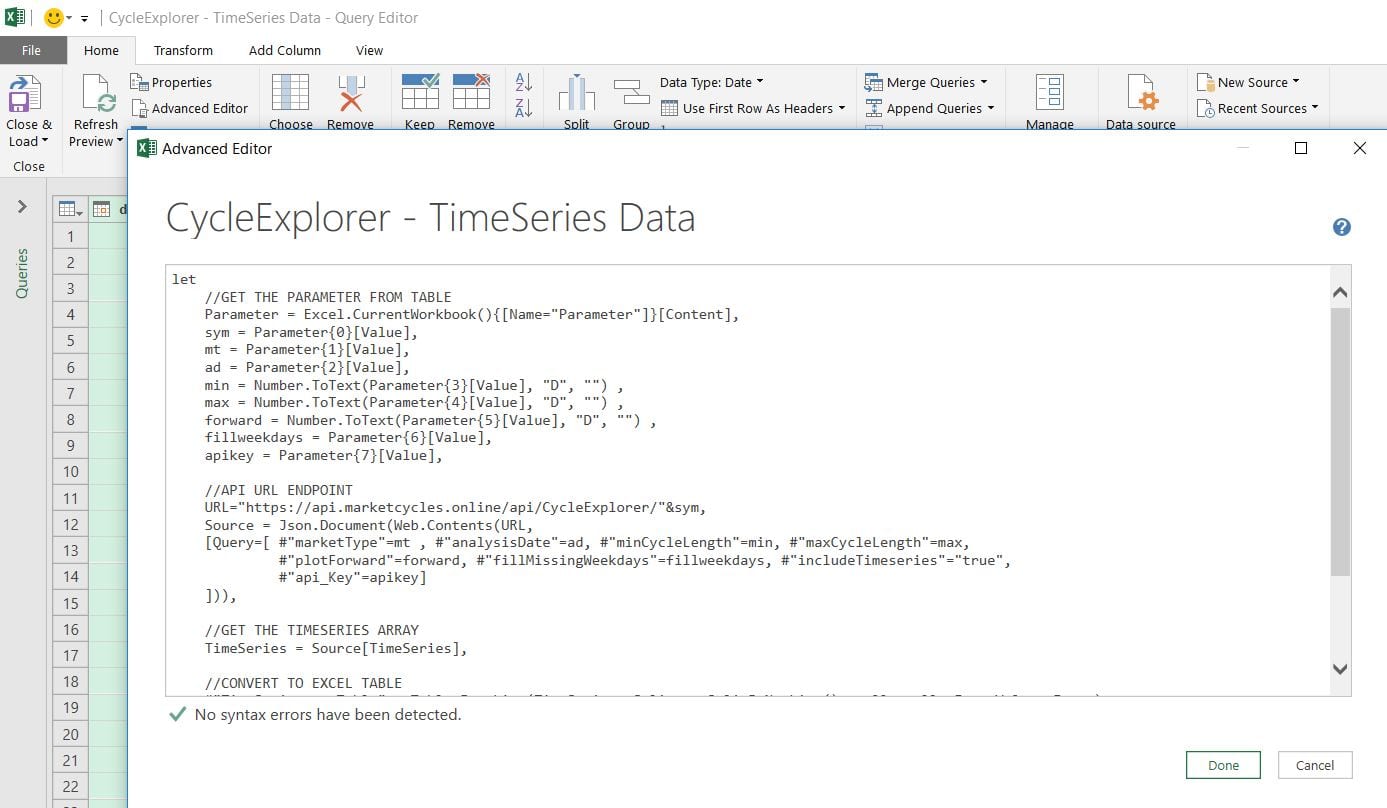
On the right hand side of the Excel window, you can see two prepared queries using our GET CycleExplorer API endpoint. If you are interested in the settings and query parameter, you can do a right-click on the query and select “Edit”. The “Advanced Editor” button shows you the detailed power query. You can see how the table “Parameter” is used to get the parameter to web source URL call.
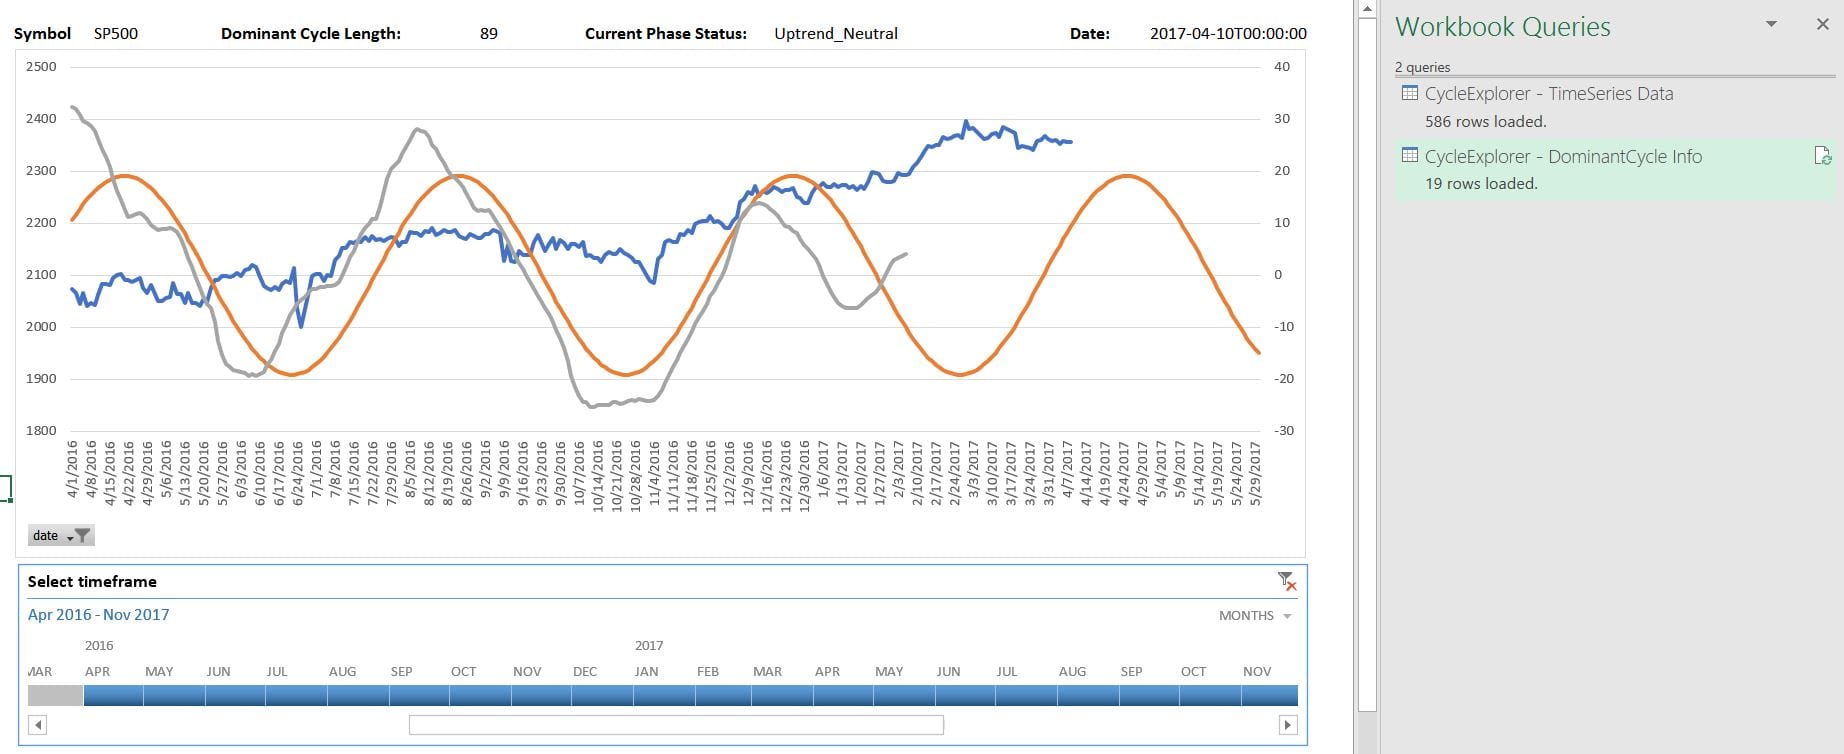
The second sheet is a prepared chart view for the retrieved time-series with the price, dominant cycle and price-cycle-highligther:
This example demonstrated the power of decoupling our backend from the front-end. This way, we can provide cycle analysis via our API and you decide which front-end software to use to analyze cycles. You can use the attached Excel sheet as starting point to expand your own analysis dashboards!
More details to rebuild this example can be found in the API endpoint toolbox documentation here


 Photo by Thought Catalog on Unsplash