GET /api/MarketCycles/{symbol}
End of Day dominant cycle analysis for 3,000 US companies, major global market indices, commodities and foreign exchange rates. Returns current dominant cycle.
Input:
- Symbol/Market to analyze for current dominant cycle.
- Range (min/max) to scan for actual dominant cycle length and last date to use.
Output:
- Current dominant cycle length in bars
- Cycle info (amplitude, phase)
- Human readable last cycle pivots as bar offset from last bar (lastlow, lasttop)
- Human readable next cycle pivots as bot offsets from last bar (nextlow, nexttop)
- Human readable current cycle phase (e.g. approaching top)
- Profitability score for trading the detected cycle against the price dataset
- Phasing Score to show the combined phase status for current long- and short-term cycle on a scale from (-200 to +200
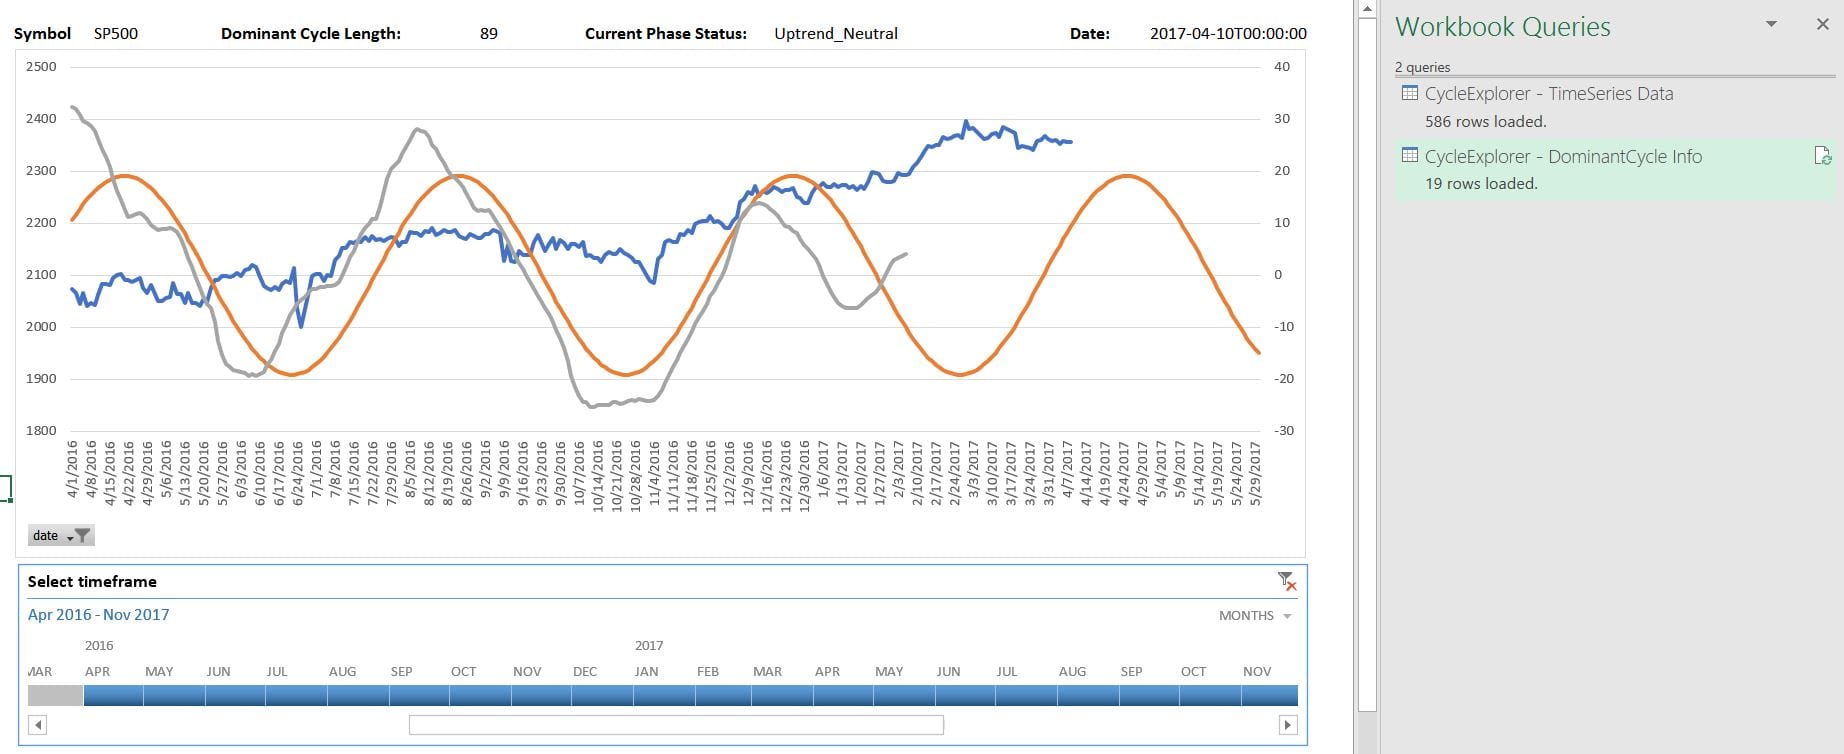
- Full timeseries datapoints with cycle value, price-cycle and close to plot a chart with dominant cycle as indicator
Example Request:
https://api.marketcycles.online/api/MarketCycles/EURJPY?marketType=FX&api_Key=wttpreview
Index – marketType: INDEX
Examples: DJIA, SP500
Federal Reserve Bank of St. Louis – FRED – Check Symbols
Forex – marketType: FX
Examples: EURUSD, EURJPY
Quandl – ECB – Check Symbols
Commodities – marketType: COM
Examples: AG_USD (Silver) , AU_LPM (Gold)
Quandl – WIKI Commodities – Check Symbols
Stocks – marketType: STOCKS
Examples: AAPL, MSFT
Quandl – WIKI EOD Stocks – Check Symbols
Crypto Currencies – marketType: CRYPTO
Examples: BTC (Bitcoin USD), ETH (Ethereum USD)
CryptoCompare – USD Toplist – Check Symbols
Wordpress / PHP
The following example uses a php function to add a new shortcode (marketcycles symbol=… market=…) to wordpress site:
Usage:
Add the following shortcode to a wordpress page to see the current dominant cycles for major indices:
(marketcycles symbol=”SP500,DJIA,NASDAQ100,NIKKEI225,VIXCLS” market=”INDEX”)
Output:
Symbol Date Price Cycle Phase Phasing Score Cycle Length Next Cycle Pivot Bars to Go
Example page:
See here: https://whentotrade.com/dominant-market-cycles/
PHP Backend:
Add the following code to your functions.php file:
[php]
// Add marketcycles shortcode
function wtt_marketcycles( $atts ) {

	// get symbol and market from attributes
	$a = shortcode_atts( array(
        'symbol' => 'DJIA',
        'market' => 'INDEX',
    ), $atts );

	$symbols = explode(',', $a['symbol']);

	$table="
| Symbol | Date | Price | Cycle Phase | Phasing Score | Cycle Length | Next Cycle Pivot | Bars to Go |
|---|---|---|---|---|---|---|---|
| %s | %s | %.2f | %s | %s | %s | %s | %.1f | ", $cycle['Symbol'], $mydate, $cycle['currentPrice'], $backcolor, $cycle['phase_status'], $pbackcolor, $cycle['PhasingScore'], $cycle['length'], $nextpivottype, $nextpivotbars)."
Excel
To get you started quickly, we provide a short Excel sheet which allows to pull up dominant cycle information for EOD ticker symbols and to plot the chart with cycle as indicator. We just use the PowerQuery functions available in Excel to connect to external data-sources.
You can dowload the ready-made pre-build workbook down below. If you want to build a workbook on your own, the quick steps are:
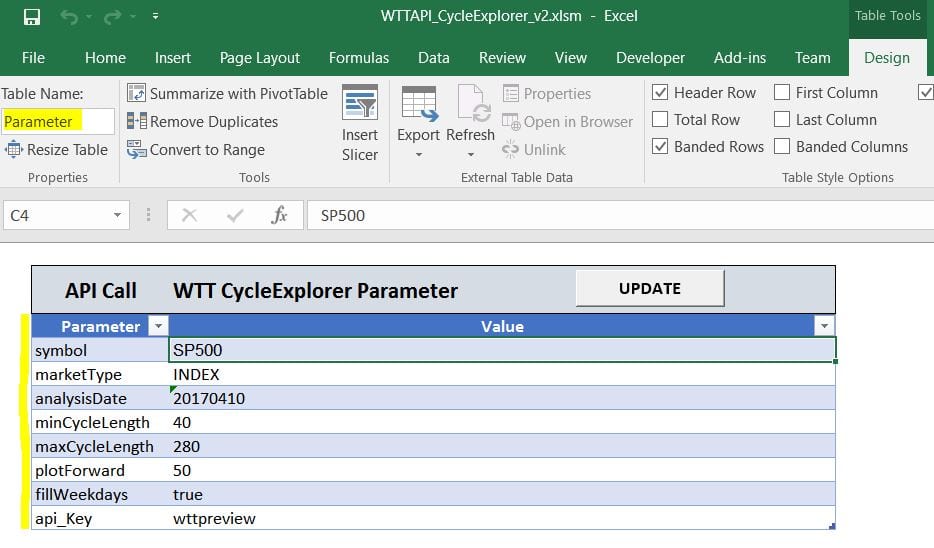
- Create & setup a table named “Parameter” where all API parameters are available:

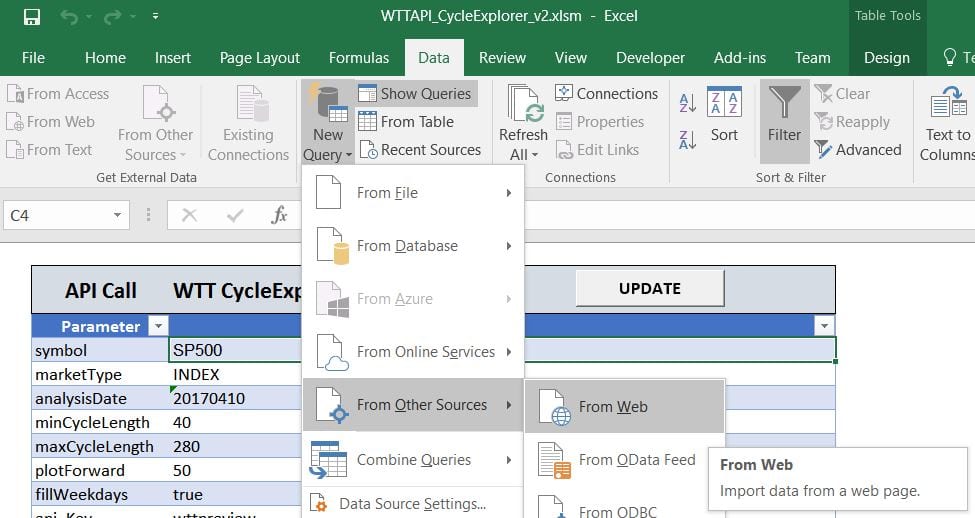
- Create a new query from web
- Enter an example API call in the windowe.g.: https://api.marketcycles.online/api/CycleExplorer/EURJPY?marketType=FX&api_Key=wttpreview
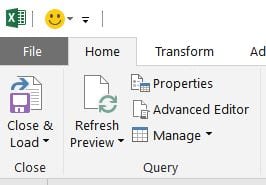
- Switch to “Home” / “Advanced Editor”
- Change or Edit the power queryThe PowerQuery to get all chart data is:
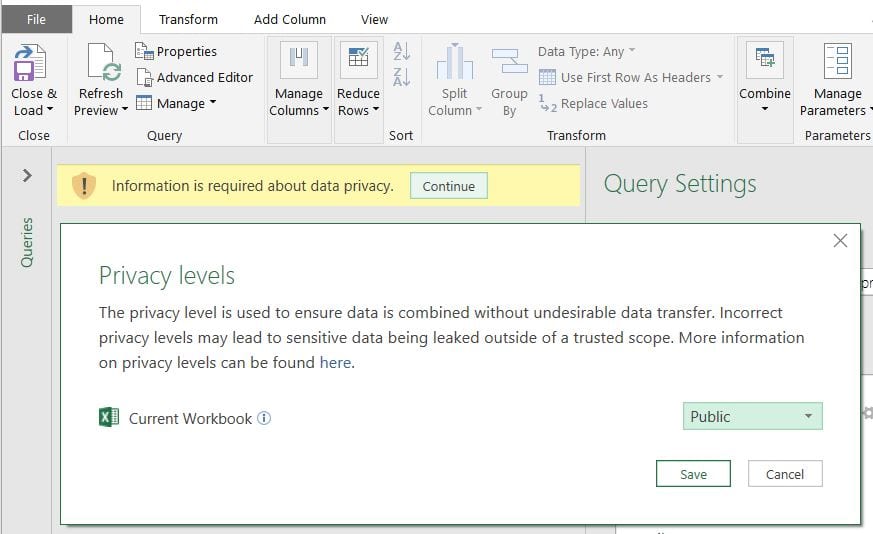
let //GET THE PARAMETER FROM TABLE Parameter = Excel.CurrentWorkbook(){[Name="Parameter"]}[Content], sym = Parameter{0}[Value], mt = Parameter{1}[Value], ad = Parameter{2}[Value], min = Number.ToText(Parameter{3}[Value], "D", "") , max = Number.ToText(Parameter{4}[Value], "D", "") , forward = Number.ToText(Parameter{5}[Value], "D", "") , fillweekdays = Parameter{6}[Value], apikey = Parameter{7}[Value], //API URL ENDPOINT URL="https://api.marketcycles.online/api/MarketCycles/"&sym, Source = Json.Document(Web.Contents(URL, [Query=[ #"marketType"=mt , #"analysisDate"=ad, #"minCycleLength"=min, #"maxCycleLength"=max, #"plotForward"=forward, #"fillMissingWeekdays"=fillweekdays, #"includeTimeseries"="true", #"api_Key"=apikey] ])), //GET THE TIMESERIES ARRAY TimeSeries = Source[TimeSeries], //CONVERT TO EXCEL TABLE #"TimeSeries to Table" = Table.FromList(TimeSeries, Splitter.SplitByNothing(), null, null, ExtraValues.Error), #"Expanded Records" = Table.ExpandRecordColumn(#"TimeSeries to Table", "Column1", { "date", "price", "dominantCycle", "cycleHighlighter"}, { "date", "price", "dominantCycle", "cycleHighlighter"}), #"Changed Type" = Table.TransformColumnTypes(#"Expanded Records",{{"date", type date}}) in #"Changed Type" - If needed, you need to change the privacy settings to allow data loading from external sources
Download Excel file with power query: