

Predicting the EUR/USD low with cycles
Predicting the EUR/USD low with cycles
How Social Media Sentiment was able to predict the largest upswing in EUR/USD since 2 years.
Back in 1949, investing legend Benjamin Graham eloquently characterized the cyclical nature of financial markets in his book “The Intelligent Investor”:
“The market is a pendulum that forever swings between unsustainable optimism and unjustified pessimism.”
Today, the emerging field of social media sentiment datasets supports Graham’s point of view, providing a strong empirical foundation for the overreaction bias that is often the driving factor in cyclical markets.
Normally, social mood waxes and wanes positively and negatively in the form of dynamic cycles. Social mood refers to a feeling, emotion or attitude about something, and, of course, it can have a range of values. Whenever mood is related to corporations or the economy, the character of events will unfold in the related financial assets. Fear and despondency represents one extreme, while thrill and euphoria represents the other end of the spectrum. (See Chart 1)
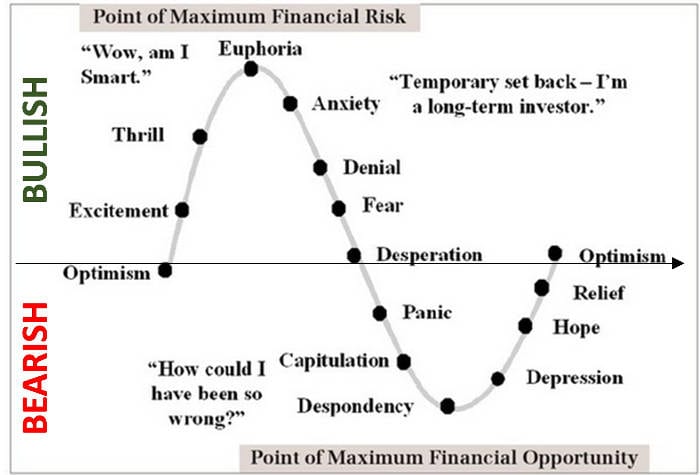
Chart 1
Cycles are the important structure here because sentiment does not jump rapidly from one state to another. A change of mood requires time; therefore, sentiment moves in dynamic cycles or waves. This is a similar process to changes in air temperature: the outside temperature does not jump from one state to another. Therefore, the challenge is to spot and predict the extreme turning points called “Maximum Financial Risk” (Euphoria) and “Maximum Financial Opportunity” (Panic/Despondency).
The fascinating aspects of market cyclicality is that the average investor badly underperforms across the board because he or she is prone to chasing performance near market tops and panicking near market bottoms.
For this reason, an effective measure of sentiment may be of significant value in identifying the “hot-spots” of maximum financial risk or opportunity within the dominant sentiment cycle.
Consequently, if you have data sets that provide raw social “mood” information related to financial assets on the one hand, and on the other hand have cyclic tools that are able to decipher and track dominant cycles, you have the toolset needed to predict and forecast sentiment “hot-spots”.
To underpin the importance on cyclic analysis of social media sentiment, we will review a real case example from March 2015 on the EUR/USD currency pair.
The EUR/USD currency pair traded at 1.081 on March 20th 2015 after pausing a multi-year downtrend for some days (see Chart 2).
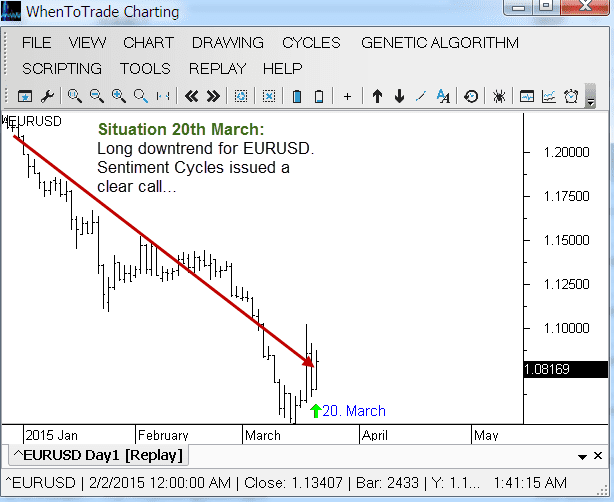
Chart 2: EUR/USD on March 20th 2015
At this point, it is of major importance to know whether this is just a pause in the overall downtrend and whether one would expect the currency pair to resume going down or to expect a major turnaround. At such times, sentiment cycles can guide the process.
First, we need raw mood information about EUR/USD. PsychSignal is a company which provides social sentiment information derived from internet chatter (www.psychsignal.com). At every second in every corner of the Internet, millions of people are expressing their emotions. In this context, PsychSignal listens to the crowd’s mood and builds bullish/bearish sentiment data clustered according to financial assets. Such bullish/bearish data is available on their website, on Quandl or directly accessible via the WhenToTrade Charting and Cycles platform.
The next chart shows the composite bullish/bearish sentiment value plotted on a chart in the lower panel. We smoothed the noisy raw data shown by the red line.
In addition, we did run our cycle detection algorithms on the composite social sentiment score. The WhenToTrade (“WTT”) platform has an integrated cycle detection algorithm and can decipher the underlying dominant cycle. WTT provides a Dynamic Cycle Explorer toolset that is designed specifically to detect and track cycles that do not stay static in real-time data sets. This is very important because we do not want to detect static cycles that fit to the past – we need cycles that can explain the past but focus more on staying in sync with current market characteristics.
The detected dominant cycle of 208 days is also shown in the lower panel on the chart. The cycle was detected automatically. The turns have been mapped with red and green arrows against the raw sentiment in the upper panel.
In theory, as with all sentiment vehicles, the scores work as contra-indicators. Thus, extreme points of bullishness should correspond to market tops, and extreme bearish composite scores should correspond to market bottoms. This is what we called the “hot-spots” of maximum financial risk or opportunity as shown in Chart 1 at the beginning of the article.
The window at the bottom of the chart shows the detected dominant cycle as a blue line. The indicator text shows that there is an underlying cycle with an active length of 208 days in the EUR/USD sentiment data set. The red plotted data behind the blue cycle shows that we have a valid match between the ideal cycle and the real score movements on the sentiment. You can compare the highs and bottoms of this cycle match with major turns in the sentiment index.
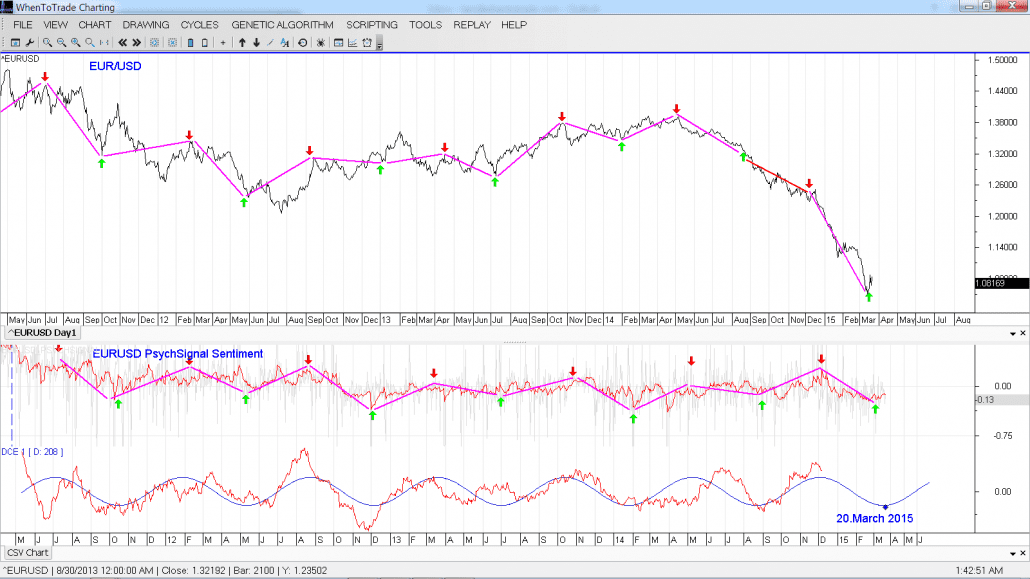
Chart 3: EUR/USD exchange rate turns in sync with detected sentiment cycle
The turns of the discovered dominant cycle are marked with red and green arrows on the price chart. We can see that we have an ideal fit between the social sentiment cycle and price turns of the currency pair. However, this cycle does not become visible on the exchange rate alone; further, the cycle does not predict the strength of each move. To see the situation more clearly, we have added a purple line to connect the arrows on the currency exchange rate.
In this context, it becomes clearly visible that it is more interesting to decipher the underlying pattern in the form of dynamic sentiment cycles than to try to interpret the raw sentiment data. In general, the raw turns of mood will not match price turns exactly because there are delays, noise, and distortions between mood and the unfolding events. Consequently, we are not interested in the micro turns of mood on the price chart; instead, we are looking for the general mood cycle to change its direction. These are what Dynamic Cycle Explorer is capable of detecting and tracking in real-time – a dynamic tool to detect cyclic points of maximum financial risk or opportunity.
It can be seen that we have a valid sentiment cycle of 208 days running – which points to the “hot-spot” of maximum financial opportunity at the day of the analysis.
As a result, we can pay close attention to where we are now in this sentiment cycle. The data analysis was done on March 20, 2015. The blue dot on the cycle marks the current day of the analysis. The important point here is that the dominant cycle shows an imminent bottom with an extreme reading of bearishness.
So we would expect the sentiment to rise over the next weeks with an expected price increase of EUR/USD happening in parallel.
Thus, we would not expect the downtrend to resume shortly; instead, we would expect a major upswing in the currency pair that follows the dominant active sentiment pattern.
We now move forward two months and check the forecast. Chart 4 shows the same EUR/USD price that was shown at the beginning of this example and progresses it eight weeks to May 15, 2015.
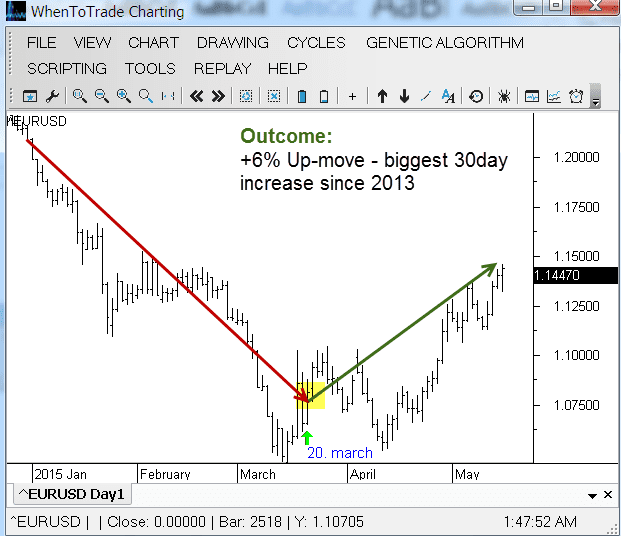
Chart 4: EUR/USD price chart 8 weeks after forecast
The analysis has proved to be extremely accurate. The EUR/USD currency pair ended its long downtrend in March 2015 and started a strong upswing. Just six to eight weeks after the forecast, prices increased by more than +5%.
But not only did this analysis projected an upturn right on time. The cyclic sentiment analysis predicted the largest 30days price increase since 2013. (See chart 5)
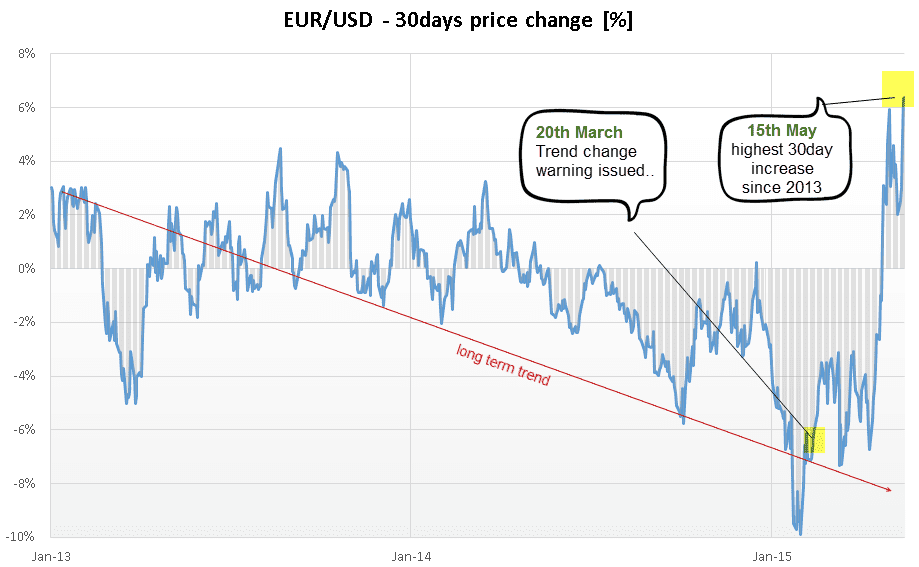
Chart 5: Biggest 30days gain in EUR/USD since 2013
It is important to mention that the cycle analysis shown in this article about EUR/USD sentiment was conducted live and in real time. This example was not cherry-picked. We alerted our community on Sunday, March 22 2015 before the market opened in the public open internet blog on PsychSignal, WhenToTrade and LinkedIn Pulse about this situation.
See original article here.
Therefore, this is a genuine and verifiable forecast based on the power of dynamic cycles and the new area of available sentiment data.
This article underpins the importance of cyclic research in social sentiment data sets in order to forecast important market turns. Thus, the combination of state-of-the-art sentiment data from PsychSignal with the latest cycle analysis and prediction tools from WTT delivers a truly unique view on financial markets.
Lars von Thienen


Leave a Reply
Want to join the discussion?Feel free to contribute!