May – FLDs: “Future Line of Demarcation”
FLD – “Future Line of Demarcation”
What are FLDs?
It is simple: Displacing price forward in time based on the half span of the dominant cycle. Shifting price into the future by a calculated time span based on the associated cycle. The shift into the future is based on half of the dominant cycle length. Hurst original: (length / 2 + 1) rounded to nearest whole number.
Als known and introduced as the „The Price Move Predictors“ by J.M. Hurst in his “Cycles Course” from 1973.
What is the value of plotting and shiffting price lines by an offset into the future?
- Once the price crosses a FLD, the formation of a cyclic price low or high is confirmed based on the analyzed cycle.
- When price crosses a FLD, a price target can be set for the next high or low of the cycle you are interested in.
- If projections of overshot, a longer cycle is in the same direction. If it is undershot, a longer cycle moves in the opposite direction.
How to measure the price target once an FLD has been crossed?
The amount that prices have fallen (risen) from this highest (lowest) price to the price at the time of the FLD break has predictive implications: Prices can be expected to move further down (up) by the same amount before reaching the price low (top) associated with the trough (top) of this particular wave.
(J.M. Hurst (1973): “Cycles Course”, Lesson 2)
The following webinar shows the fundamentals behind the FLD concept on how to apply it with the cycle analyzer toolset:
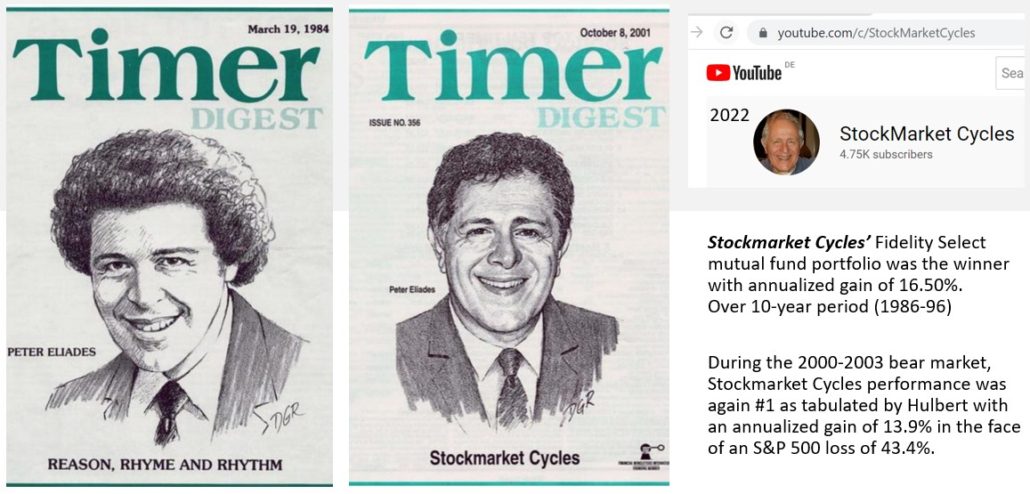
One of my cycle analyst friends, Peter Eliades, is using this technique for years. To learn how this method is applied to charts, you can follow his free public youtbube channel: Video Channel: https://www.youtube.com/c/stockmarketcycles

Peter Eliades from Stock Market Cycles using FLD Future Line Demarcation

